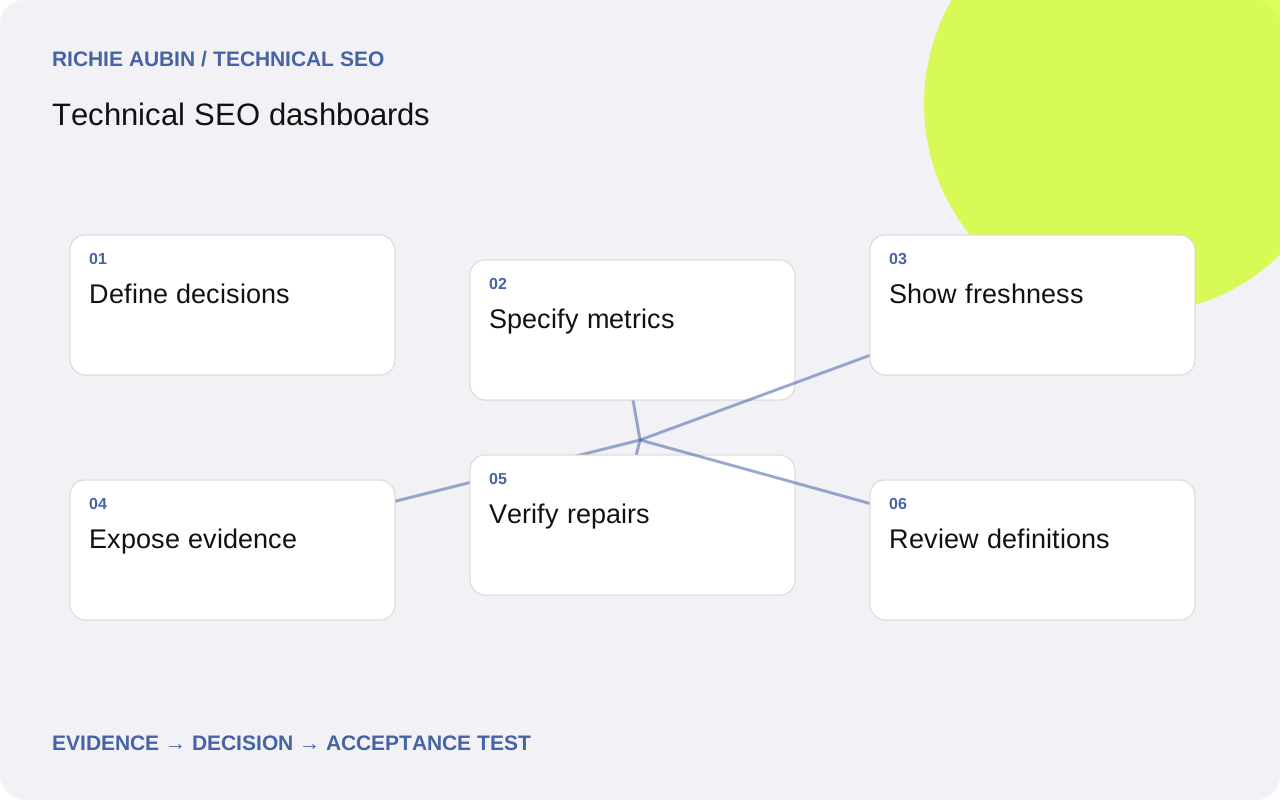
Build the dashboard around decisions and owners
A technical SEO dashboard should help someone decide whether to investigate, repair or accept a change. Begin with the audience’s responsibilities. A release owner needs current acceptance failures and evidence. A technical lead needs affected templates and unresolved incidents. A reporting audience may need a stable view of coverage and verified progress, without every individual crawler warning.
Write the action beside each proposed metric. If nobody can explain what a movement would trigger, reconsider whether the metric belongs on the primary view. A total count of warnings can grow because the website expanded, collection improved or a rule changed. Without population and definition context, that number is difficult to interpret responsibly.
Use separate measures for observed technical state, Google’s recorded indexing evidence, search performance and collection health. They can support one investigation without becoming interchangeable indicators. The automation overview explains the underlying evidence model. A compact dashboard can preserve these distinctions through precise labels, timestamps and drill-down evidence rather than collapsing them into an unexplained overall health score.
Specify metric definitions and denominators
For every metric, document the unit, population, source, calculation, update interval and owner. A public-page directive failure rate needs a denominator of successfully evaluated public pages and a separate count of unknown observations. Show the expected inventory as well, so collection gaps remain visible. Do not count untested pages as healthy simply because they have no failure record.
Distinguish unique affected URLs from observations and incidents. A shared template defect can create hundreds of URL failures but only one repair task. Both views can be useful if their meaning is explicit. Deduplicating repeated observations should not erase the size of the affected population or make recurring regressions appear as a single old event.
Keep metric definitions versioned. A new canonical policy or parser can change the count without a website change. Annotate that break and compare a matched population under consistent rules when assessing progress. The data quality guide covers the key, grain and missing-data contracts that make these calculations reliable before they reach a chart.
Show current state, change and evidence together
Organise the primary view around current actionable conditions. Show the affected segment, count, denominator, first and latest observation, owner and investigation status. Distinguish confirmed defects from pending hypotheses. A clear table can communicate this more accurately than a large collection of gauges whose colours depend on undocumented thresholds.
Use trends when time genuinely helps interpretation. Mark releases, collection interruptions and metric-definition changes. Avoid drawing an uninterrupted line through missing periods. Compare stable cohorts as well as the full current population so newly published or retired content does not disguise what happened to existing pages. Keep absolute counts visible beside rates.
Provide a route from each headline to exact examples and source evidence. Include the requested URL, expected behaviour, observed value, timestamp and rule version. Preserve the original URL even if the display groups canonical variants. The dashboard should shorten investigation, not require analysts to reconstruct its input files before they can determine which page or template actually needs attention.
Keep source freshness and coverage visible
Display extraction time and source observation period separately. A freshly downloaded Search Console inspection record can describe an older crawl. Performance extracts describe an explicit date range. A live response collector describes its request time. Those timestamps should remain visible when sources appear alongside one another, especially during release investigations.
Search Analytics rows are not an indexed-URL inventory, and missing rows are not confirmed exclusions. Keep query filters, dimensions and aggregation available in the metric definition. Avoid turning a missing performance join into a red indexability badge. Use selective inspection or current response evidence when the unresolved question concerns those distinct states.
Include collection health near the findings: expected records, completed observations, unknowns, last accepted run and current failure reason. A failed import should produce a stale or unavailable state, rather than an empty green panel. The API guide explains endpoint semantics and operational errors. The primary report should expose enough of that context for users to recognise when the evidence cannot support a current conclusion.
Report Core Web Vitals without mixing field and lab
For field Core Web Vitals, good thresholds are LCP at or below 2.5 seconds, INP at or below 200 milliseconds and CLS at or below 0.1, assessed at the 75th percentile with relevant device segmentation. Keep units, device category and evidence source explicit. Require the relevant metric set before describing a complete passing assessment.
Label URL and origin evidence separately. An origin aggregate does not establish identical experience for every page. If a URL lacks sufficient field evidence, show unavailable and provide origin context only under its own label. Do not silently fill the URL’s missing value from an origin aggregate, and do not average page percentiles to invent an origin percentile.
Keep laboratory tests in a diagnostic view with their configuration and run time. A controlled audit helps investigate possible causes but is not a replacement for field experience. CrUX’s rolling 28-day collection period also overlaps recent releases, so field movement will not isolate the newest version immediately. Link to field versus laboratory data for interpretation rather than promising that a good laboratory score demonstrates passing real-user performance.
Evidence checklist, competing hypotheses and a worked example
The evidence checklist includes metric definition, source parameters, population membership, calculation version, freshness, collection completeness and representative URL records. Every alerting chart should also identify its owner and the next discriminating check. A movement is a prompt for investigation until competing explanations have been evaluated against source evidence.
Illustrative worked example: a fictional publisher’s dashboard shows public directive failures falling from 90 to 30. Its expected inventory is 900 pages, but the latest collection contains only 600 successful observations. These invented figures teach interpretation rather than describe a real project. Possible explanations include a template repair, retirement of affected pages or failed collection of a problematic template.
The investigator compares matched URLs, inventory changes and collection logs. Suppose the missing 300 observations belong to a template that timed out. The headline must show incomplete evidence, not a claimed two-thirds repair. Keep the previous accepted full-population result labelled with its age. After collection recovers, recompute the comparable cohort and verify exact repaired responses before reporting technical progress.
Implementation acceptance criteria for dashboard delivery
Accept the dashboard only when each headline reconciles with its source table at the declared grain. Require unique keys, stable filters, explicit missing states and a visible definition for every denominator. Test a partial import, expired API access and a changed schema so users can see how unavailable evidence appears. A polished layout cannot compensate for a misleading failure state.
Verify that a reviewer can follow a selected metric to the exact URL evidence and reproduce the classification. Check intentional exclusions and unknown observations as well as confirmed failures. Require date and segment controls to preserve comparable definitions rather than silently switching sources or aggregation when a user selects a different period.
For incident workflow, include owner, status and verification evidence. A closed ticket is not automatically a technically verified repair; the relevant output must be rechecked. The technical monitoring guide explains repeat observations and escalation. A dashboard should reflect those distinctions and make newly regressed conditions visible even when the same incident category was resolved in an earlier release.
Rollback risks and limits of dashboard conclusions
Retain the previous accepted metric definitions, transformation code and output snapshot. Test calculation changes against a fixed evidence sample before publication. If a revised parser changes counts unexpectedly, restore the prior reporting version with an annotation while investigating. Do not reverse a legitimate website repair merely because a dashboard change made its trend harder to read.
Chart redesigns also carry interpretation risk. Changing axes, aggregation periods or category colours can suggest a performance movement where none occurred. Annotate material definition changes and keep comparable historical values available where practical. Avoid silently backfilling unknown periods with zero or drawing a continuous improvement trend across incompatible measurement methods.
Technical dashboards describe selected observations and workflow state. They do not establish that a repair caused traffic growth or guarantee rankings, indexing, rich results or AI citations. Google’s FAQ rich result feature was retired in May 2026, so it should not appear as an active opportunity metric. Continue publishing useful answers for readers, and review feature-dependent reporting against current official documentation before carrying historical assumptions into a new dashboard.
Frequently asked questions
Which metrics belong on the first dashboard view?
Choose measures tied to a decision and a responsible owner: current confirmed regressions, affected public populations, unresolved unknowns and collection freshness. Include the denominator and exact evidence route. Search performance can provide context, but should remain distinct from technical compliance and Google’s recorded indexing state.
Should a dashboard use one overall SEO health score?
Only if its definition and intended decision are clear, and its components remain accessible. A weighted score can hide a critical public-page exclusion behind many passing minor checks. Direct measures and incident summaries are often easier to interpret, especially when populations or collection completeness change between runs.
Can missing field performance data be replaced with lab scores?
Not under the same label. Field evidence and controlled laboratory results describe different observations. Show missing field data explicitly, preserve URL versus origin scope and use laboratory output for diagnosis. Report Core Web Vitals thresholds against the appropriate field percentile rather than treating a laboratory performance score as equivalent.
How can the dashboard show that an issue was fixed?
Attach a verification observation demonstrating that the agreed technical acceptance criteria now hold for affected examples and relevant controls. Record deployment and verification times, and retain any unresolved coverage gaps. Later search changes can be reported with their date range and limitations, but they are separate from proof of the technical repair.