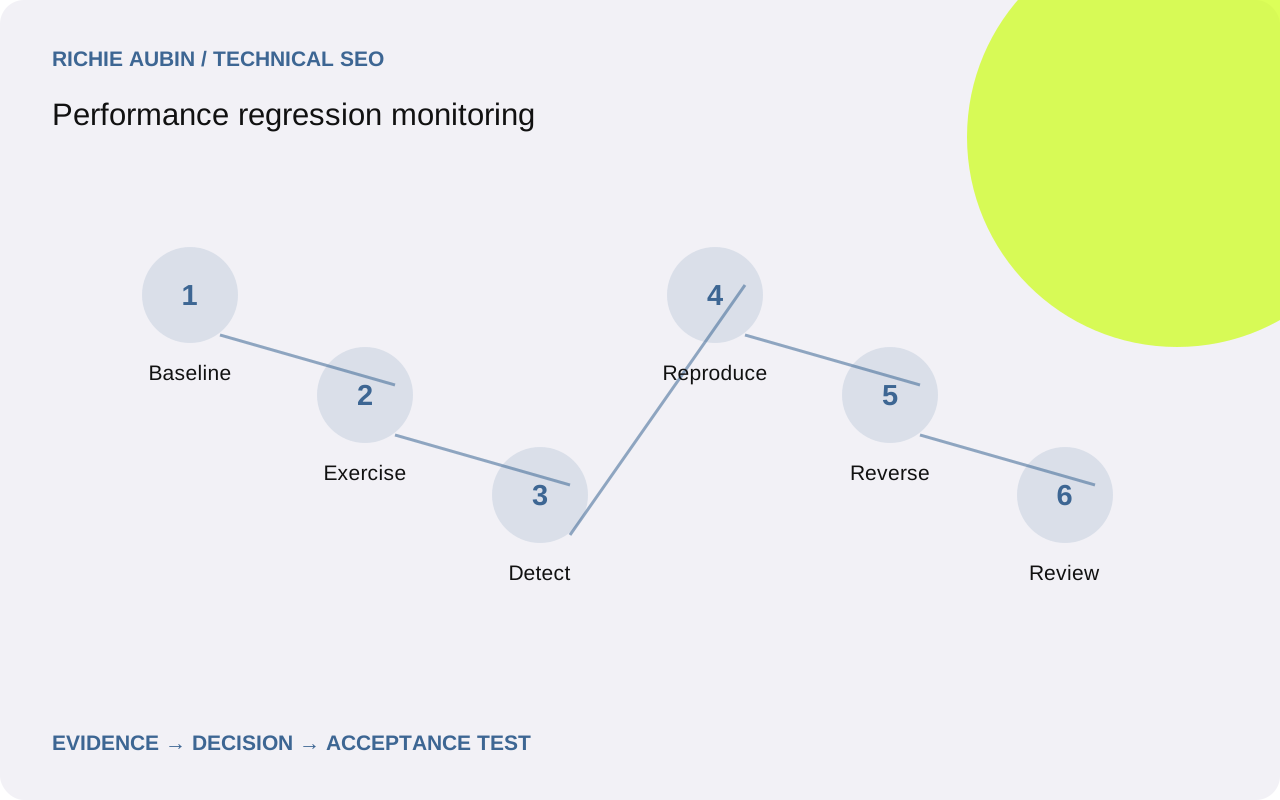
Define the regressions worth interrupting someone for
Performance monitoring should detect a change that someone can investigate and reverse. Start with important journeys and shared components rather than collecting every available score. A product gallery, category filter, editorial template and checkout form need different checks. Identify the owner, the user consequence and the likely deployment boundary for each monitored experience.
Separate release gates, production detection and longer-term field review. A build gate catches a known budget breach before deployment. A production synthetic test checks a controlled journey after deployment. Field monitoring reveals what observed visitors experience across real conditions. These layers can disagree without either being defective. The performance overview explains the underlying metrics. Agree which failures should block a release, which should create an investigation and which should remain informational. Without that distinction, every fluctuation becomes urgent and the genuinely serious changes disappear into alert fatigue. Give each alert a concrete action rather than merely a colour.
Build a representative baseline and retain its conditions
Choose URLs and journeys that cover important templates, content variation and known fragile components. Include an awkward product, a populated category and a long article where relevant. Keep a stable comparison set while maintaining a separate list for newly introduced templates. A changing sample can look like performance movement even when each page behaves identically.
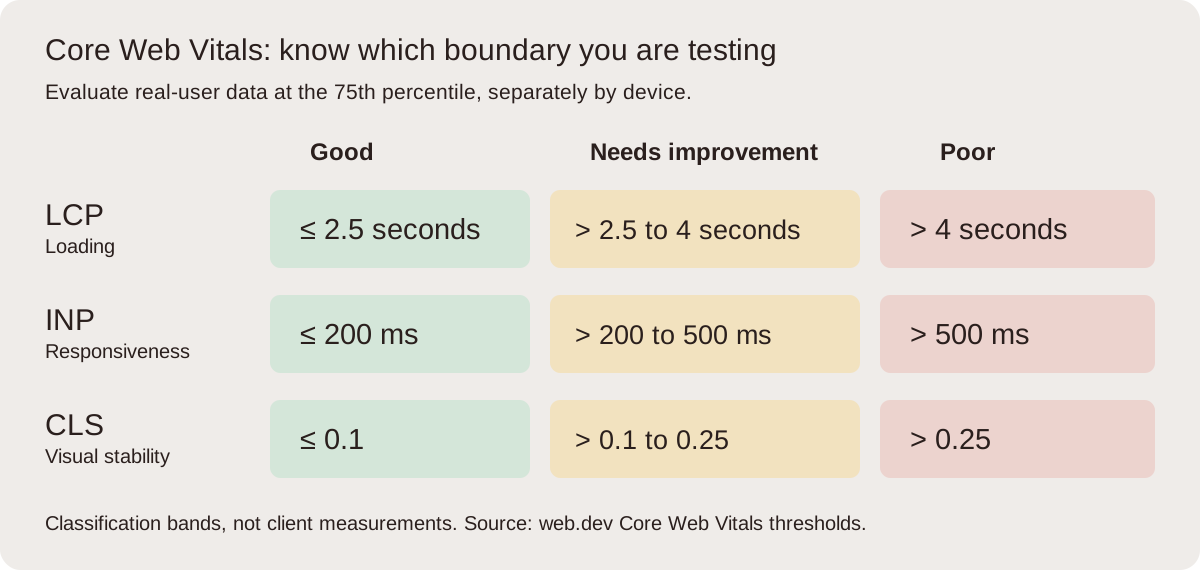
For synthetic checks, record device profile, viewport, CPU and network settings, browser version, cache policy, consent state, authentication and test location. Preserve raw traces for failures and a recent healthy baseline. For field checks, record source, reporting window, device category, scope and observation counts where available. Good field thresholds are LCP at or below 2.5 seconds, INP at or below 200 milliseconds and CLS at or below 0.1 at the 75th percentile. Do not transfer those values blindly into a noisy build gate. Local laboratory budgets need their own baseline and tolerance policy so a runner fluctuation does not repeatedly stop safe work.
Monitor journeys as well as initial loading
A loading-only check can detect a late primary image but miss slow filters, modal opening and layout shifts after scrolling. Define short scripts around the actions users actually perform. Assert the expected state as well as collecting timings: the filter must return the right products, the dialog must open and the submit button must not create duplicate requests.
Use traces to retain the candidate element, request sequence, main-thread tasks or shift events needed to explain a failure. Avoid treating an aggregate score as enough evidence. The INP workflow helps design interaction checks, while layout shift diagnostics covers post-load movement. Test first use and repeat use separately when code loads on demand. Keep scripts short enough to remain maintainable, but long enough to encounter the dependency that has previously failed. A monitor should reproduce a meaningful experience, not navigate to a URL and declare the entire application healthy.
Design alerts that account for noise and coverage
Compare repeated observations rather than paging on one unusual run. Use a persistence rule and an agreed magnitude relative to the baseline, then preserve the underlying values so the threshold can be reviewed. Distinguish unavailable tests from failing performance. A browser runner crash is an operational problem; it does not establish that the website became slow.
Field alerts need sample and scope guards. A sparse cohort should become uncertain rather than zero, and an origin fallback should be visibly different from URL-level evidence. Rolling windows overlap, so successive daily values are not independent experiments. Annotate deployments and traffic changes. The evidence checklist for an alert includes affected route or template, device, source, time window, current and baseline observations, test conditions, release identifier and a reproduction artefact. Include the next action and owner in the notification destination agreed by the team. A concise, explainable alert is more useful than a long report whose most important comparison is hidden.
Triage with competing explanations before reverting
When a check fails, first confirm the monitor ran correctly. Compare runner health, browser version, location and configuration. Next confirm the page state: a new consent dialog, advertising response or experiment can change the journey. Then compare the release and dependency graph. Keep deployment regression, third-party variation and population change as separate hypotheses until evidence distinguishes them.
Reproduce the failing case and inspect the stage that moved. For loading, compare candidate and request timing; for interaction, compare input waiting, processing and presentation; for stability, identify the component that changed geometry. Use field versus laboratory interpretation if a public report and the monitor disagree. Do not automatically reverse the latest release merely because it is recent. A controlled reproduction and a trace can show whether the release plausibly affected the path. Conversely, a broken purchase flow should not wait for a rolling field window to confirm the obvious operational fault.
Illustrative example: a browser update looks like a release fault
Illustrative example: a synthetic monitor reports slower loading across several unrelated templates immediately after a release. Field telemetry shows no clear new deterioration, but its short-window sample is limited. Competing explanations include the release, a shared delivery fault and a change in the test environment. The monitoring log reveals that the browser runner updated at the same time.
Repeat a previous production build and the current build on the same runner version, then compare a representative physical-device trace where practical. Keep the URL content and cache conditions matched. If both builds show the same synthetic movement, the evidence weakens the release hypothesis. It does not prove every visitor is unaffected, so continue field observation and inspect the changed browser behaviour. This illustrative example claims no measured result. Its point is that release annotations alone are insufficient: environment metadata and preserved baselines are necessary to prevent a confident but unsupported rollback recommendation.
Set acceptance criteria for the monitoring system itself
A monitoring implementation should prove it can detect a known change and avoid misclassifying missing data. Use a controlled fixture or safe test environment with an intentionally delayed resource or interaction. Verify the alert includes the right route, evidence, owner and release context. Then restore the fixture and confirm recovery is visible without generating a confusing new incident.
Require stable cohort labels, timestamps with clear time zones, raw artefact retention and a documented policy for browser updates. Check that expired credentials and runner failures appear as collection failures. Protect sensitive URLs and authenticated states from unnecessary logging. The acceptance checklist should include maintenance ownership and a procedure for adding a new template. Use release QA to make these checks part of deployment practice. A dashboard that renders attractive numbers but cannot explain which version or journey they describe is not ready to support release decisions. Operational correctness belongs in acceptance alongside chart accuracy.
Keep reversal and ongoing maintenance practical
Define rollback triggers around functional breakage, increased exceptions and a credible sustained regression in the monitored experience. Keep an earlier feature path or configuration available where practical. Retain asset versions needed by cached documents and open sessions. Reversing application code without considering caches can leave the public experience inconsistent and make the monitoring evidence harder to interpret.
Review thresholds when the product, audience or test environment changes, but preserve the old baseline for explanation. Retire obsolete checks deliberately and document why; silently deleting a noisy monitor removes institutional memory. Confirm that fixes remain effective as content grows and third-party behaviour changes. Close an incident with the cause, evidence, action and remaining uncertainty, then update the relevant check if it missed the fault. Performance monitoring does not prove a ranking effect or guarantee indexing. Its value is a shorter, clearer path from a real regression to a safe corrective decision, with enough evidence to distinguish a website problem from a measurement problem.
Frequently asked questions
Should a single slow test block deployment?
Usually not without context. Repeated matched observations and a clear magnitude rule are more reliable than a solitary run. Some failures, such as missing primary content or a broken purchase control, deserve immediate action regardless of timing noise. Separate functional stop conditions from numerical performance tolerances.
How should low-traffic pages be monitored?
Use controlled tests for representative templates and clearly label missing field evidence. Suitable real-user telemetry may provide additional insight, but small samples remain uncertain. Do not substitute a broader origin value without showing the scope change, and avoid interpreting no observations as a fast experience.
What should a performance alert contain?
Include affected journey, device, source, reporting window, baseline comparison, release context and a useful artefact such as a trace. Name an owner and the next diagnostic action. Distinguish collection failure from website failure so the recipient knows whether to investigate the monitor or the application.
When should an incident be closed?
Close it after the cause is addressed, functional and controlled checks pass, and the field review status is documented. If a rolling window still contains older experiences, record confirmation as pending with an owner and date. Keep monitoring active and state any unresolved coverage limits rather than claiming certainty too early.