Choose the problem before the tool
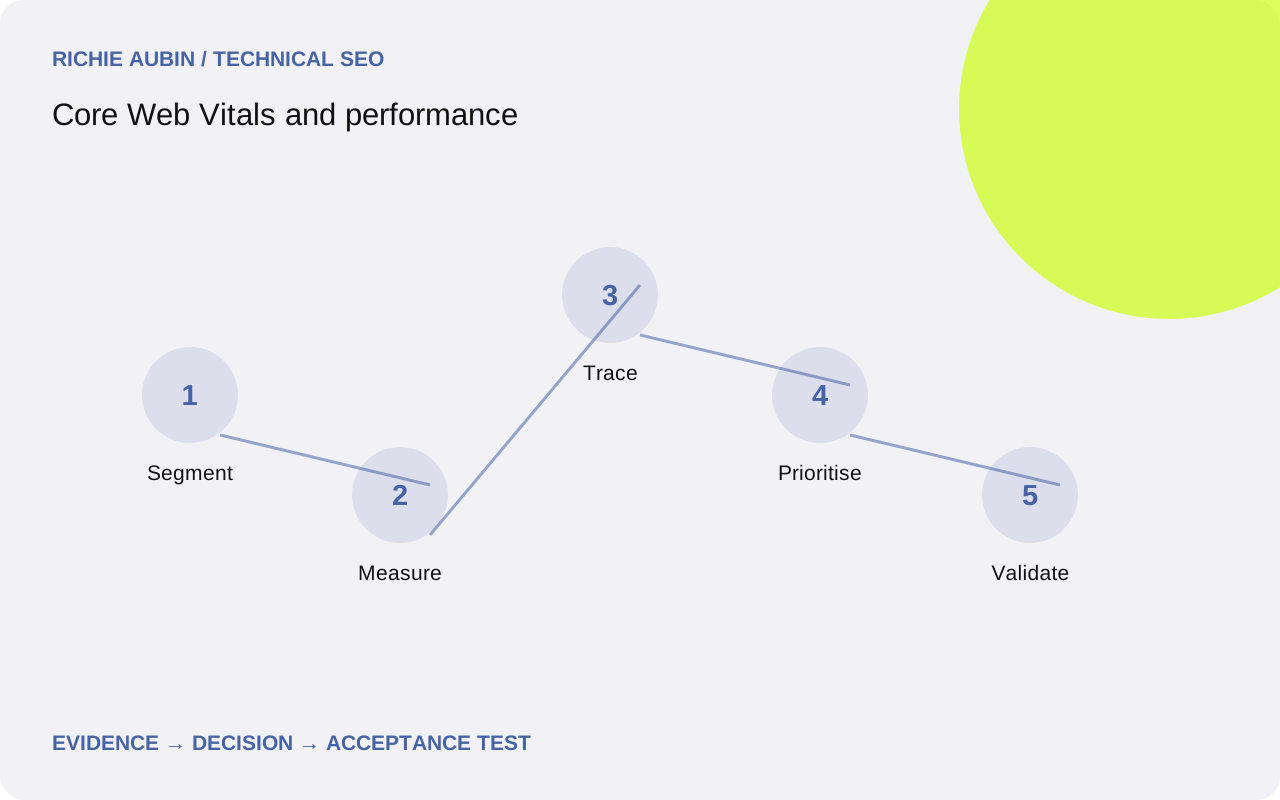
A performance programme needs a decision framework before it needs another dashboard. Group pages by the components and journeys they share: product galleries, category filters, editorial templates and checkout steps. Then ask which groups expose users to a poor experience, how often it occurs and which team controls the likely cause. A heavily used filter with sluggish responses can deserve attention before a quiet page with a larger loading delay.
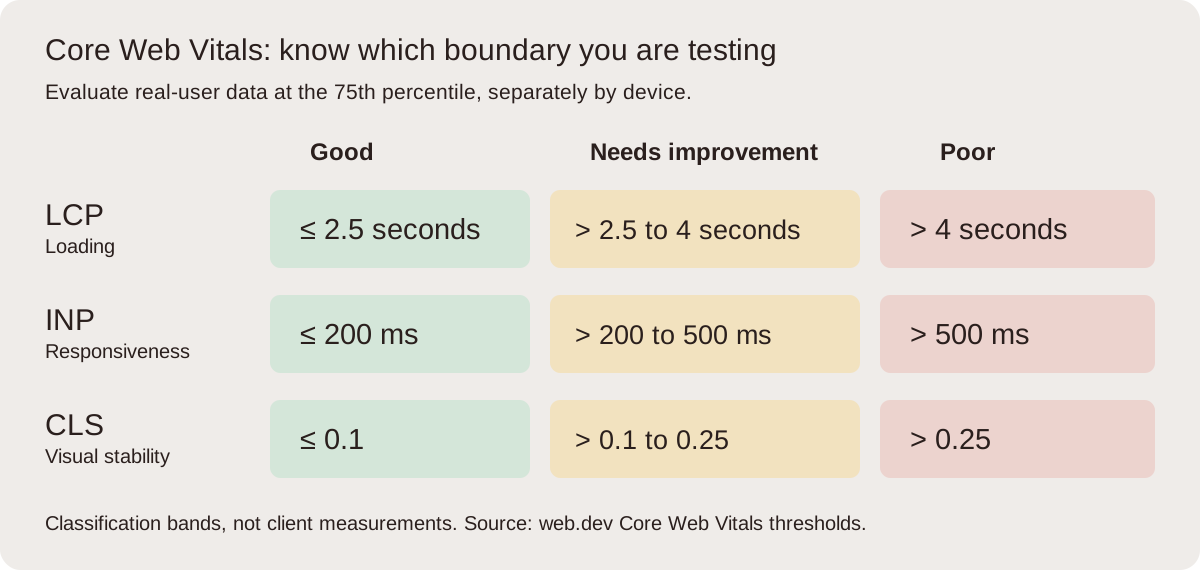
Use three separate outcomes. Largest Contentful Paint, or LCP, concerns loading the largest eligible visible content. Interaction to Next Paint, or INP, concerns responsiveness to qualifying interactions. Cumulative Layout Shift, or CLS, concerns unexpected visual movement. Good thresholds are LCP at or below 2.5 seconds, INP at or below 200 milliseconds and CLS at or below 0.1, assessed at the field 75th percentile. Keep mobile and desktop assessments separate. Passing these thresholds does not guarantee rankings, indexing or commercial success; it establishes a useful performance standard.
Build an evidence pack that survives handover
For each suspect template, collect the field source, reporting window, device category, URL or origin scope, sample availability and release dates. Add an exact reproduction URL, screenshots of the relevant page state, consent choice and a browser trace. Preserve both the poor case and a comparable healthy case. A developer should be able to see the symptom without reconstructing your working environment from memory.
The evidence checklist should also include navigation type, cache conditions, connection profile, viewport and whether the visitor interacted before the problem. These details distinguish a repeat visit from a cold landing and a static screenshot from a real journey. Record unknowns explicitly. Missing URL-level data cannot be repaired by silently substituting an origin average. Use the field and laboratory comparison when reports disagree. The purpose of this pack is to narrow a decision, not accumulate impressive-looking exports. Stop collecting when the next test is clear.
Send loading problems to the right dependency
For slow LCP, identify the actual largest content element in the failing viewport. The obvious hero is not always the measured candidate: text, a gallery slide or a consent-dependent component may take its place. Follow the navigation response, resource discovery, download and rendering sequence. An image cannot finish early if JavaScript does not reveal its address until after hydration.
Competing explanations require different fixes. A slow server response suggests delivery or application work; a late image request suggests discovery; a long transfer suggests resource sizing; a long gap after download suggests rendering dependencies. Compressing an already small image will not remove a stylesheet blocking its appearance. The LCP diagnostic workflow breaks those stages down. Treat proposed preloads as a prioritisation change with costs: promoting several resources can displace the genuinely important one. Make the critical path shorter before adding hints everywhere, and check which element wins again after the change.
Investigate responsiveness as a journey
A page can load quickly and still struggle when someone opens a menu or selects a product variation. Record the interaction, the work already occupying the main thread, the event handler and the rendering that follows. Separate waiting to start, processing the event and presenting the next frame. That separation stops every slow response becoming a vague request to reduce JavaScript.
For instance, a filter may wait behind analytics initialisation, spend time sorting a large list, or trigger an expensive layout after the handler ends. Those are competing hypotheses, not interchangeable descriptions. Test the real control on a representative device with the same data volume. Read INP diagnostics for a deeper investigation. Do not accept an animation that merely hides a blocked interface as proof of resolution. Immediate feedback helps, but the underlying task still needs to remain correct, accessible and cancellable where appropriate. Also test a second interaction while the first is still completing.
Treat stability as a space contract
Layout stability depends on components agreeing about space before their content arrives. Images need a predictable ratio, advertising needs an agreed slot policy, fonts need manageable fallback differences and asynchronous modules need sensible placeholders. Start with a recording of what moved, then inspect what changed immediately before it. The shifted paragraph may be the victim of an expanding component above it.
Follow the same journey beyond initial loading. Scroll, expand details, accept consent and wait for personalisation. A clean loading trace can miss later movement. The layout shift guide explains attribution and exclusions in more detail. Avoid solving a metric by creating unusable blank areas or trapping content in fixed-height containers. A good space contract allows text expansion, narrow screens and larger font settings. Stability is valuable because it helps people retain their place and hit the intended control, so functional and accessibility checks belong beside the numerical result.
Illustrative example: choose a shared cause
Illustrative example: a shop has poor mobile loading on product pages and slow variation selection. An initial proposal replaces the image format across the entire catalogue. A trace instead shows the gallery URL appearing only after a sizeable application bundle executes. Variation selection then rebuilds the whole product panel, including the gallery. These observations suggest one shared architectural dependency, while image transfer remains a separate hypothesis to test.
The first experiment exposes the primary image in the initial HTML and narrows the state update to the variation controls. Compare matched product pages with the same image dimensions, data and consent state. Record request start time, the winning LCP element, interaction processing and visual stability. Keep the image format unchanged during this experiment so its contribution stays interpretable. If the request starts earlier but painting remains late, investigate CSS and gallery visibility next. This example illustrates a decision sequence; it is not a claim about a client, a measured improvement or a guaranteed fix.
Write developer acceptance criteria around behaviour
An implementation ticket should identify affected templates, the confirmed dependency and the expected change in the trace. For a gallery fix, specify that the initial primary image address is discoverable without application execution, that only the intended candidate receives elevated priority and that variant changes preserve the selected product. Include viewport cases and the exact steps needed to reproduce the old fault.
Require repeated comparable laboratory tests, a recorded functional journey and a plan to review post-release field cohorts. Set local budgets from the baseline and agreed service expectations rather than inventing a universal bundle size. A useful acceptance statement names the cause removed and the experience protected. A single green Lighthouse score is insufficient when the original fault occurs after interaction. Check errors, accessibility, analytics and layout alongside speed. The performance monitoring workflow provides the ongoing release checks once the immediate ticket is complete.
Limit conclusions and keep reversal practical
Field reports can improve because traffic composition changed, and laboratory results can vary because a cache warmed or the runner became less busy. Check those explanations before crediting the release. A recent change may be underrepresented in a rolling reporting window. Sparse cohorts should remain uncertain rather than being promoted into a confident success story. Correlation with search traffic does not isolate a ranking effect.
Release dependency changes behind a controlled switch where practical. Keep the previous asset strategy available and define reversal triggers such as broken purchasing, increased JavaScript errors, missing content or a clear regression in another metric. Reverting code may not immediately restore cached HTML and assets, so coordinate cache behaviour and asset retention. Give the field review an owner and a date, while using shorter-window evidence for early detection. Performance work is complete when the specific user problem is addressed, the implementation remains safe and someone can detect its return.
Frequently asked questions
Should every page have its own Core Web Vitals project?
Usually no. Start with shared templates and components, then investigate exceptions where field evidence or important journeys differ. Test representative URLs with different content lengths, media and consent states. A template fix can cover many pages, but a shared template does not prove every URL behaves identically.
Can a good laboratory score prove that a site passes?
No. Laboratory tests describe controlled runs and are useful for reproducing causes. A field assessment reflects eligible real experiences over its reporting window. Keep the device category, URL scope and metric definition visible before comparing them, and use controlled tests to explain rather than replace field evidence.
Which metric should be fixed first?
Choose the largest credible user problem that your team can affect. Compare affected journeys, frequency, business importance and confidence in the diagnosis. A shared dependency that damages loading and interaction may be a better first project than a small isolated threshold miss. Document the trade-off explicitly.
How quickly should field data confirm a release?
That depends on the source, traffic and reporting window. Recent real-user telemetry can show an early cohort difference, while rolling reports mix older and newer experiences. Record the deployment time, allow enough comparable observations and avoid declaring failure simply because a long reporting window has not fully changed.